This may seem like old news to some of you now, but earlier this year I moved across the world, back to the USA to the sonoran desert of Tucson, Arizona to start the next phase of my career: Head of Education and Public Outreach (EPO) for the Large Synoptic Survey Telescope (LSST).
If you haven't heard of this amazing new telescope being built in Chile right now, here's an intro video I'm proud to have produced:
To find out more about the EPO program itself, you can watch the video below or see slides from a recent talk I gave.
Ida Luna and I are surviving our first desert summer and monsoon season - it's beautiful and dramatic and I can't wait to see what happens next!
During one of our recent walks around the neighborhood, a nice old man stopped Ida and I for a chat. When I mentioned her name, he instantly started singing a lovely melody "Ida, sweet as apple cider..." which I had never heard before. I asked him about it and he claimed it was just one of those old-timey songs he liked, "you know, one that a barbershop quartet would sing!"
So of course I looked it up when we returned home and learned it immediately. She even dances when I play it for her :) Music time is my favourite part of our days!
My unofficial hack at last week's .Astronomy 7 conference in sydney was to perform a song i wrote recently called Sky Schemes. Luckily, Becky recorded it for all to hear!
Sky Schemes
By Amanda Bauer (2015)
On winter nights when I was a girl
I’d go to her house after school
We’d play game, make things, discover our dreams
I’d walk home through the dark remembering our schemes
I’d look up at the stars, shining overhead
Make constellations that I saw instead
Of those Greek ones, Islamic ones, they are so old
There are native ones, Indigenous ones, but we’re seldom told
I made one up. It was a bird, wings spread wide
I’d look for it, find it, feel so much pride
So look up at the stars, shining overhead
Make constellations that you see instead
There are new ones, trues ones, you will see first
Share them with us, through us, satisfy your thirst
To know things, understand, how we are here
No true answer you’ll find, but it will become clear
The questions that matter are changing all the time
Rely on your instincts, empower your mind
And then look up at the stars, shining overhead
Make constellations that you see instead
Photo by Andy Green
Photo by Andy Green
also, another quick announcement that you might suspect from the photo below... go to THIS LINK and keep exploring until you uncover the surprise :) this reveal was also made as a result of .Astronomy hack day.
"A 2dF night at the AAT" assembles 14 time-lapse sequences taken at the 4-metre Anglo-Australian Telescope (AAT) located at Siding Spring Observatory NSW, Australia. This time-lapse video shows not only how the Two Degree Field (2dF) instrument works but also how the AAT and the telescope dome move in tandem, and the beauty of the Southern Sky in spring and summer.
The video is 2min 50sec long and combines more than 4000 frames obtained using a CANON EOS 600D with a 10-20mm wide-angle lens. All sequences were taken during September and November 2011 by astronomer Dr Ángel R. López-Sánchez while he was working as the 2dF support astronomer for the AAT. The music is the song “Blue Raider” from Composer Cesc Villà's album “Epic Soul Factory”
I published this article at The Conversation last week, reproduced here for your enjoyment :) Original article link.
Seeing the Universe Through Spectroscopic Eyes
When you look up on a clear night and see stars, what are you really looking at? A twinkling pinprick of light with a hint of colour?
Imagine looking at a starry sky with eyes like prisms that separate the light from each star into its full rainbow of colour. Astronomers have built instruments to do just that, and spectroscopy is one of the most powerful tools in the astronomer’s box.
The technique might not produce the well-known pretty pictures sent down by the Hubble Space Telescope, but for astronomers, a spectrum is worth a thousand pictures.
Visible spectra reveal huge amounts of information about objects in the distant cosmos that we can’t learn any other way.
So what is spectroscopy?
Spectroscopy is the process of separating starlight into its constituent wavelengths, like a prism turning sunlight into a rainbow. The familiar colours of the rainbow correspond to different wavelengths of visible light.
The human eye is sensitive to the visible spectrum – a narrow range of frequencies among the entire electromagnetic spectrum. The visible spectrum covers wavelengths of roughly 390 nanometers to 780 nanometers (astronomers often use units of Angstroms (10-10), so visible light spans 3,900 to 7,800 Angstroms).
Once visible starlight reaches the curved primary mirror of a telescope, it is reflected toward the focal point and can then be directed anywhere. If the light is sent directly to a camera, an image of the night sky is seen on a computer screen as a result.
If the light is instead sent through a spectrograph before it hits the camera, then the light from the astronomical object gets separated into its basic parts.
A very simple spectrograph was used by Issac Newton in the 1660s when he dispersed light with a glass prism. Modern spectrographs consist of a series of optics, a dispersing element and a camera at the end. The light is digitised and sent to a computer, which astronomers use to inspect and analyse the resulting spectra.
The video (above) shows the path of distant starlight through the 4-metre Anglo-Australian Telescope (AAT) and a typical spectrograph, revealing real data at the end.
What do spectra teach us?
A spectrum allows astronomers to determine many things about the object being viewed, such as how far away it is, its chemical makeup, age, formation history, temperature and more. While every astronomical object has a unique rainbow fingerprint, some general properties are universal.
Top shows a spiral galaxy spectrum. Bottom shows non-star-forming galaxy spectrum. Screenshot from Australian Astronomical Observatory video above
Here we examine the galaxy spectra shown in the video. The spectrum of a galaxy is the combined light from its billions of stars and all other radiating matter in the galaxy, such as gas and dust.
In the top spectrum you can see a few strong spikes. These are called “emission lines” and occur at discrete wavelengths due to the atomic structure of atoms as electrons jump between energy levels.
The hydrogen spectrum is particularly important because 90% of the normal matter in the universe is hydrogen. Because of the details of hydrogen’s atomic structure, we recognise the strong hydrogen-alpha emission line at roughly 7,500 Angstroms in the top spectrum image.
In a galaxy, only the youngest, biggest stars are hot enough to excite surrounding hydrogen gas enough that the electrons populate the third energy level, before falling to the second lowest, thus emitting a hydrogen-alpha photon.
Because of this, we know the strength of the hydrogen-alpha line in a galaxy’s spectrum indicates how many very young stars there are in the galaxy. Since the bottom spectrum shows no hydrogen-alpha emission, we can conclude that the bottom galaxy is not sparking new life in the form of shining stars, while the top galaxy harbours several hard working stellar nurseries.
In the bottom spectrum you can see a number dips. These are called “absorption lines” because they appear in the spectrum if there is anything between the light’s source and the observer on Earth absorbing the light. Absorbing material could be the extended layers of a star or interstellar clouds of gas or dust.
The absorption lines close to each other below 5,000 Angstroms in the bottom spectrum are the calcium H and K lines and can be used to determine how quickly stars are zooming around the galaxy.
In a galaxy how far away?
A basic piece of information derived from a spectrum is the distance to the galaxy, or specifically, how much the light has stretched during its journey to Earth. Because the universe is expanding, the light emitted by the galaxy is stretched toward redder wavelengths as it innocently moves across space. We measure this as redshift.
To determine the exact distance of a galaxy, astronomers measure the well-studied pattern of absorption and emission lines in the observed spectrum and compare it to the laboratory wavelengths of these features on Earth. The difference tells how much the light was stretched, and therefore how long the light was travelling through space, and consequently how far away the galaxy is.
The absorption lines ‘shift’ the farther away an object is, giving us an indication of its distance from us. Georg Wiora (Dr. Schorsch)
In the top galaxy spectrum mentioned earlier, we measure the strong red emission line of hydrogen-alpha to be at a wavelength of roughly 7,450 Angstroms. Since we know that line has a rest wavelength of 6,563 Angstroms, we calculate a redshift of 0.13, which means the light was travelling for 1.7 billion years before it reached our lucky telescope. The galaxy emitted that light when the universe was roughly 11.8 billion years old.
Australia’s strength in spectroscopy
Australia has led the way internationally for spectroscopic technology development for the last 20 years, largely due to the use of fibre optics to direct galaxy light from the telescope structure to the spectrograph.
A huge advantage of using optical fibres is that more than one spectrum can be obtained simultaneously, drastically improving the efficiency of the telescope observing time.
Australian astronomers have also led the world in building robotic technologies to position the individual optical fibres. With these, the AAT and the UK Schmidt Telescopes (both located at Siding Spring Observatory in New South Wales) have collected spectra for a third of all the 2.5 million galaxy spectra that humans have ever observed.
While my own research uses hundreds of thousands of galaxy spectra for individual projects, it still amazes me think that each one of these spectra are composite collections of light created by hundreds of billions of stars gravitationally bound together in a single swirling galaxy, many similar to our own Milky Way home.
later today, the new horizons space craft will fly by pluto at a distance of only 12,500 km - its closest approach is about 1 earth away. that's incredible!
this mission has already given us way better views of the dwarf planet than we've ever achieved (even with hubble). what will the new data tell us? what does the surface looks like? (are there craters? ice? cracks? plumes? mountains?) what is the atmosphere is made of? (methane, nitrogen, and what else?) does its surface ice turn to gas during different seasons and then does it get released to space?
ultimately, we want to understand what the objects way out in the kuiper belt are made of because they can tell us how all the other planets and the entire solar system was formed.
Created by Alex Parker with NEW images of pluto!
new horizons cannot send data back at the same time it is taking images, so it is following an automatic program, written by the engineers and astronomers, to maximize its data collection during the flyby. we will receive the first message and prelim images tomorrow (july 15th, 2015 - it takes 4.5 hours for the data to reach earth). cant wait!
then new horizons will start sending data back to us over the next ~16 months as it flies away out into the depths of the kuiper belt at the outskirts of our solar system.
i'm excited.
i talked (enthusiastically) to Patricia Karvelas on radio national's drive program last friday about pluto and what to expect from this flyby. you can LISTEN HERE.
Giving a presentation is your opportunity to share your passion about a topic with an audience and empower them to wonder "why?" about the same questions that fascinate you. When the audience walks away with a deeper understanding of something you’ve convinced them is important, they will remember you and what you gave to them.
Communicating complex science ideas does not come naturally to everyone, but is a skill that can be developed with a little practice and a few basic tips. The effort is well worth the reward the first time an audience member gasps at what you say or you see a child excitedly explaining something she learned from you to her family.
The first step, before preparing any material for a presentation, activity, or interaction with the media, is to pause and think about three simple things. Make this process a part of your routine.
1. Isolate the BIG IDEA 2. Tell a story 3. Respect the audience
I will describe these three things in more detail and then give some practical suggestions to use during your presentations later in the article.
Isolate the BIG idea
What is the main thing you want your audience to walk away from your presentation understanding? This is a single statement. Say it to yourself out loud. “I want the audience to go home understanding how big the sun is.”
It is not true that adding more facts and sharing a large list of information during the brief time you have your audience’s attention is doing them a favour. Quite the opposite! As you add more facts and numbers to your presentation, the audience will start to forget the early items, their attention will drift, and they might even lose the Big Idea, which means you’ve wasted your time and theirs.
Identify the Big Idea and then 3 key points that you will use to convey your Big Idea to the audience. The rest of your interaction with them, whether it’s 5 minutes or an hour, will be bringing the audience along the journey of understanding the Big Idea and why it matters.
Tell a story
Start your science story with a hook that will instantly grab their attention. Maybe you start by asking a provocative question that might relate to their lives. You can ask them to raise their hands if they have experienced a particular thing or ever thought about how long it takes light to travel from the Sun to Earth – at the speed of light. (Eight minutes.) You can tell a quick anecdote about a person who experienced your Big Idea and how it made them feel or how it applied to their life. Try to share the human side.
Telling the story of your Big Idea will need to be presented differently for different audiences. It's not appropriate to recycle the exact same talk or activity for everyone. You should adjust presentations and activities to make them relevant to the group you are trying to reach. Have a conversation with them.
Respect the audience
This is where you consider your audience. Remember that your presentation is not about you, it’s about your audience and what you are bringing to them. Giving a presentation is your opportunity to share your fascination about a topic, leaving an audience feeling empowered by the deeper understanding of something you’ve convinced them is important.
Be mindful of the language you use: avoid jargon, get to the point, skip the details. Jargon consists of technical terms that help experts talk to each other efficiently, but is not used in everyday conversation. To a colleague you could say the sun’s diameter is 2 orders of magnitude bigger than the Earth’s. But to a general audience you would say it’s 100 times bigger. Remember, you want the audience to understand you and the words you use.
Think about what the particular audience needs to understand your story. More visuals? Interactive participation to demonstrate a concept? Talking briefly to each other about their experience? Empathise with your audience to help them get the most out of your interaction with them.
Visualise concepts and avoid using numbers
Approximate size of the Earth relative to the Sun. Image: NASA
This type of visualisation is much more memorable for the audience than a large number. Image: NASA
As a general theme, if you find yourself writing a lot of text on a slide in a presentation, especially numbers or equations, think again. Find or create a visual way you can present the concept instead.
For instance, you could write on a slide that the Sun’s diameter is 1,391,684 km. This number has no relevance to our every day experience and is therefore meaningless, other than the audience knows it’s big. You could simply say that 100 Earth’s fit across the face of the Sun. This is a better way of sharing the size because it makes it relevant to a scale the audience knows: the Earth.
Better yet, if you’re giving a visual presentation, you can show an image of the sun from a space telescope and then insert an image of the Earth next to it at its relative size. This visualisation is much more memorable for the audience than a large number. Always minimise the numbers you share and try to visualise the concept instead.
Also be mindful of the colour choices you use on your slides. Blue text on a white background is difficult to read. Small text is impossible from the back of the room (you should use at least a 20 point font, but usually bigger). And remember that some people in the audience will be colour blind.
All content should convey meaning
The content of your slide should be useful and informative for the slide’s main point. You should not read the text (there should never be that much text on a slide!). Practice so that when you look at your slide you can recall your main point. You can use notes in any presenter tool to give yourself clues, but you (and therefore your audience) should be able to identify the main point from the visual clues. Otherwise, rework your slide or practice more!
Practice your presentation
Even the most experienced presenters take time to rehearse what they will say before they say it in front of an audience. Give yourself a confident start
Memorize your opening and closing lines - they make the most impact. Really practice the introduction to give yourself a confident start and allow yourself to relax into the rhythm of the presentation. Your closing line will also make a strong impact. Practice your final summary statement and then afterwards thank the audience for their time and attention. This gives the audience the helpful cue that you are finished and welcomes them to applaud.
The shorter the talk, the more you need to practice
Memorising every word of an hour-long talk is time consuming and not practical. When giving a 50-minute presentation, practice by going through each slide one-by-one and recalling the main point.
When giving a 10-minute talk, practice at least 5 times. When giving a 5-minute talk, practice enough times that you finish in 5 minutes every time without saying “um.”
Ask for feedback
Practice your talk in front of friends, colleagues, or mentors and listen to the constructive criticism you receive.
Record yourself
It is challenging and can feel embarrassing to watch yourself speak, but the practice is so useful! You might find that you need to look up at your audience more, or that you say “um” too often, or you make a clicking sound with your tongue that you didn’t realize you made. You’ll notice your posture and whether you talk too fast, or discover that you do a very strange thing with your hand while you talk! This is a tough but rewarding practice.
Stick to time
It is disrespectful to the audience and makes you look unprepared if you go over time. The audience will become restless when you speak longer than the time allocated and they will not retain the information you rush to fit in at the end. It is important to practice your presentation so you can stay to time and leave your audience feeling inspired and respected.
Use technology wisely
When deciding how to present to a certain group, it is not a question of “How can I use this fancy new technology?” You know your Big Idea and the three key facts you will use to tell your story. Now identify which technology will best help unfold this story. It’s finding the most appropriate tool for the job.
You can use the technology to put cues in your talk that only you can see to remind yourself to take a breath and speak more slowly or to regain your audience’s attention when you notice it inevitably drifts.
Human beings have attention spans of roughly 10 minutes, and probably less than 20% of the audience will be paying attention at any given moment. This means it will be helpful for you to remind the audience of your main points throughout your presentation or try a few other tricks.
To regain the audience’s attention, change your focus every few minutes: vary the tone of your voice, use audience participation, , use the keyboard’s "B" key to provide a blank screen and bring attention back to you (try it out, it works!).
Speaking with young students
Young students are an active audience and they will be very eagre to share their stories with you! They want to show how something you’ve said relates to their life or how their mom read them something in a book once that kind of sort of relates to the topic. While being interactive with the students by asking them to raise their hands or vote throughout your presentation is useful, they will want to stop you during the presentation and ask questions, which often turn into long-winded stories once they’ve been given the attention.
An option is after you introduce yourself, tell the students that you know they’ll have a lot of interesting questions and stories to share with the group, and they will get a chance, but you have so much exciting material to get through that they should wait until the end of the presentation to ask questions.
Then at the end, start at one side of the room and hand a student an object (either ask the teacher for an object, or bring in something related to the topic). The student can ask ONE question, or not, and hand the object to the next student. This way every student gets a chance to share if they want, and you don’t accidentally call on the same student who keeps raising his hand while neglecting a potentially shy student unwilling speak up. Only a few students will pass the object without commenting.
This works for a classroom of up to 30 students, but will take at least 20 minutes. If you have an hour with the group, talk for 30 minutes and then begin this activity. If the group is a lot bigger, it won’t work. If the students are older than about 11 years old, they usually have the attention span to handle a 45 minute presentation with a few questions at the end.
Talking to media
Always make a list of three things you want to convey to the journalist. Practice saying them out loud before the interview. Also write down a few items that you do not want to talk about if such items exist. If the journalist asks those things you can say “I prefer not to comment on that at this time.” Or “That is not relevant to the results I’m presenting today, so I won’t comment now.” Or even “That is not my area of expertise, so I won’t comment on that.” You can suggest other scientists who are experts in the area, if you want, or you just leave it and wait for another question. Or you can start talking about one of your three main points again.
Relax and enjoy
Finally, if you’re feeling particularly nervous before a presentation or interview, stand up, stretch your arms up out to the corners of the room and look up at the ceiling. Take a few deep breaths in this powerful posture. Also, a tall stance with broad shoulders will give you more confidence as you’re speaking.
Remember – have FUN! This is your opportunity to share your passion with an audience eagre to hear about it and understand why it’s important and so exciting to you.
Amanda Bauer is a Research Astronomer and Outreach Officer at the Australian Astronomical Observatory. She was named among the Top 5 Under 40 Australian researchers and science communicators in 2015 and was a Fresh Science finalist in 2013. She has been invited to give science communication talks at Gemini, dotAstronomy 5, Harley Wood Astronomy Winter School. Follow Amanda on Twitter @astropixie
Resources
Watch Amanda describe her research and why it’s relevant in 30 seconds in this Radio National video produced as part of Top 5 Under 40.
i'm pleased to finally be able to share with you a project i've been working on for a while!
a lot of my research depends on collecting spectra, as opposed to pretty pictures, of distant galaxies.
every astronomical object has a unique spectrum, or “rainbow fingerprint”, that allows you to determine its contents, age, formation history, movements through space, temperature and more!
this video follows starlight from the distant cosmos as it hits the primary mirror of the 4-metre Anglo-Australian Telescope (AAT) and is guided along the inside of optical fibres. the optical fibres feed the starlight to the spectrograph, which is a series of special optics, including an advanced type of prism, and separates the light into its rainbow spectrum.
the separated light is focussed onto the CCD detector (like the one in your phone, but bigger, more sensitive, and more expensive!).
the end of the video shows actual data from the AAOmega spectrograph. each horizontal line represents single astronomical objects - in this case galaxies. the short, bright streaks shooting in any direction are caused by cosmic rays, which zoom through our bodies and the Earth all the time! At last, the video reveals the final science quality spectra for two different types of galaxies, one spiral and one elliptical.
i recently finished reading Kurt Vonnegut's second novel, The Sirens of Titan. overall, an enjoyable read. i like how vonnegut plays with words and patterns and patterns of words so nonchalantly. it feels like an efficiently written story, deceivingly simple, yet so much happens throughout!
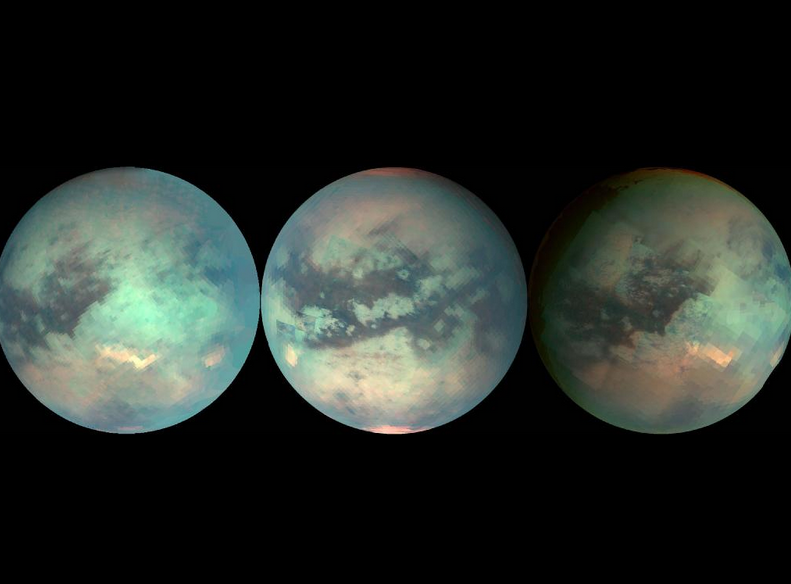
Saturn's largest moon, Titan (Image credit: NASA/JPL/University of Arizona)
it seems fitting that just as i finish reading this book, NASA published a new video, Approaching Titan a Billion Times Closer, in honor of the Huygens probe touching down on Titan, ten years ago this month!
titan is saturn's largest moon and the only moon in the solar system with a dense atmosphere. the video shows a collection of images taken by the cassini spacecraft and then images from huygens, as it fell down to the surface of titan in 2005.
Information is power. But like all power, there are those who want to keep it for themselves. The world's entire scientific and cultural heritage, published over centuries in books and journals, is increasingly being digitized and locked up by a handful of private corporations. Want to read the papers featuring the most famous results of the sciences? You'll need to send enormous amounts to publishers like Reed Elsevier.
i experience this everyday in how much myself and my institutions have to pay to publish and read science results. the cost is stifling. it's a racket. there are some solutions in the works, like the Public Library of Science (PLOS).
but of course some people will try to make money off anything, and the negative side of open access over the last couple years has seen the rise of predatory publishers. i receive regular invitations to publish in these "journals" and to give talks at bogus conferences. to spot predators, look out for: bad spellings, copycat titles with a hyphen added, and check the Directory of Open Access Journals (DOAJ).
i think the culture within the "hard sciences" has a leading role in dictating how and what eventual laws will be enacted, because it is a progressive community relative to others, despite what it might feel like to the open access proponents within the community. repositories like github and bitbucket are good examples of where open-source software can be developed in a public, collaborative way.
we need to be raising deep questions about content ownership and information access, both personal and otherwise, all across the internet. the time is now.
Cory Doctorow said: "Aaron had an unbeatable combination of political insight, technical skill, and intelligence about people and issues. I think he could have revolutionized American (and worldwide) politics. His legacy may still yet do so."
let's hope so.
anyway, watch that documentary. it's incredibly interesting (and heart-breaking) and relevant.
This April 24th marks the 25th anniversary of the launch of the Hubble Space Telescope!?! hard to believe the old girl has lasted this long and continues to be used by astronomers to produce some AMAZING science and images.
of course most people arent purposely trying to offend others with their words or actions, but sometimes it happens unintentionally and needs to be acknowledged, not ignored. it's easy to say “Oh I didn’t mean it like that” or “You’re interpreting it the wrong way,” but the intent doesn’t really matter because it’s a matter of intent versus *impact*.
"It doesn’t matter in these instances what you meant. What matters is what's the outcome of what you said or what you did. I use the example of stepping on somebody’s foot. I might step on your foot and break your toe. I didn’t mean to break your toe, but your toe is still broken and it still really hurts, so instead of talking about what you meant to do, talk about what you actually did."
so how should you respond if you or someone you know unintentionally offends someone? watch this video and listen to her words, or read the transcript here.
why we shouldnt ignore instances of racism, sexism, homophobia, etc...
just because someone doesnt intend to do harm doesnt make it permissible for them to do so. i've talked to people who were unintentionally making others uncomfortable. they didnt realise their behaviours were doing so and felt awful once they realised. they changed their behaviours (even if its as simple as changing some specific words they use) and everyone was much better off. these things shouldnt be ignored.
the only way racism, sexism, homophobia, etc. will get any better is if people other than just the victims recognise, acknowledge and speak up when injustices happen. we can be easily blinded by privilege.
Physicist Brian Cox visited NASA’s Space Power Facility in Cleveland, Ohio (!!!) to perform a fantastic science experiment!
did anyone ever tell you that a bowling ball and a feather would fall at equal speeds if it weren't for air resistance? i didnt think it would be so interesting to watch the actual experiment, but they did a great job with this short clip!
Comet C/2013 A1 (Siding Spring) will pass within 139,500 km (86,000 miles) of the surface of Mars at 5:51 tomorrow morning (Monday 20 Oct, Sydney time - or 19 October at 18:51 UTC). This means Comet Siding Spring will pass 10 times closer to Mars than any (recorded) comet has flown by Earth! But it will be traveling at 50 km/s which is too fast to be captured by Mars's gravitational pull.
Comet Siding Spring was discovered by Rob NcNaught at Siding Spring Observatory in New South Wales on 3 January 2013. Last night Steve Lee took this beautiful image of Comet Siding Spring and Mars against the dusty backdrop of the Milky Way using a 90mm refractor and Canon 6D camera, from a location VERY CLOSE to siding spring observatory!
Comet Siding Spring, Mars, and Milky Way dust (Photo by Steve Lee (AAO))
The comet is still composed of the pristine material the solar system was made from, which will give insights into the formation of planets!
For a list of ways to view the comet (if you dont have your own telescope or are covered in clouds), see The Planetary Society blog by the great Emily Lakdawalla here.
i'm SO EXCITED to finally get to reveal this short film "steve and the stars" to everyone. i worked with the bluebottle group to produce it for the AAO. i think it captures the excitement and wonder, that cosmic vertigo that comes when thinking about our place in this unfathomably huge universe of ours. so lucky to be able to do this as my job!
the official blurb and behind-the-scenes shots while filming in july 2014!
Ever wonder what it's like to stay up all night using a world class 4-metre telescope?
In celebration of 40 years of discovery with the AAT, the AAO has made a short film, Steve and the Stars.
The star of the show is Head Telescope Operator, Steve Lee, who has worked at the AAT for almost its entire 40 years of operation.
Steve guides this video tour of working with the AAT, exploring how observational techniques have changed from the 1970s to today's digital age, and the AAT’s exciting future pursuing more world-class discoveries.
The live footage was shot and edited in July 2014 by Bluebottle Films with time-lapse material by AAO's Angel Lopez-Sanchez.
just hanging with the tarantula nebula and the large magellanic cloud :)
danielle and james from bluebottle films. great to work with them!
Never tire of sunrises on siding spring observatory
for the three eclipse visible in australia this year, geoff sims (beneath beyond) managed to rush away from most clouds to film each event! he gorgeously captures australian landscapes, cloud motions, and lunar and solar eclipses in this time-lapse video.
- Total Lunar Eclipse (April 15th) near Byron Bay - Partial Solar Eclipse (April 29th) on the edge of the Blue Mountains - Total Lunar Eclipse (October 8th) near Lithgow
the final eclipse shown, which took place last wednesday evening, was happening when i busted my knee playing soccer. more news on that after i visit the sports medicine doctor tomorrow. my guess: not good at all :(
i've been working to launch an AAO YouTube channel and guess what - it finally happened! our first instalment is a new time-lapse video from AAO's Angel Lopez-Sanchez filmed at siding spring observatory.
please enjoy "the sky over siding spring observatory" and subscribe to the AAO's YouTube channel to keep up to date with the video releases i'll be posting once a month or so. topics to be covered include: what is a spectrum, a short documentary about observing, how we re-aluminize the 4-meter telescope mirror, the construction of a new $18 million dollar instrument, and possibly a ukulele rock video ;) stay tuned!